Updated: 2026-10-21 18:03 ET · Reached via the profile icon (top right, signed in) → Settings →
(/settings) → DIAGNOSTICS group → Show App Logs (/settings/logs)
TLDR: The Diagnostics group's on-device log viewer,
which replaced the old native MetroLog screen. It shows real captured entries, narrows them by search, minimum severity and
category, opens any entry in full, and exports every log file as a zip through the share sheet. Help desk staff: start
with Guiding a member to send logs.
For help desk: guiding a member to send logs
Applies to ALPA Mobile 5.0.17 and later (released 2026-10-05). The version is shown at the bottom of
Settings. A member on an older version should update from the App Store or Google Play first.
What the logs are. The app keeps a record of what it did on this device over the last 7 days: screens
opened, server calls and errors. Sign-in tokens, member numbers and email addresses are removed before anything is
written, and nothing leaves the device until the member shares the file. Each screen change is one line starting
[Nav]: how the member moved (Push, Pop, Replace), the screen's route,
how many screens deep the back stack is, and the screen they came from.
The member must be signed in. Settings is reached from the profile icon, which appears only when signed in.
If the problem is that they cannot sign in, ask for screenshots of what they see instead.
1 · Ask for the context first
The logs are only useful next to a description. Before the steps below, get:
The date and time it happened, with time zone. Entries are time-stamped, so this is how we find them.
What they were doing: which screen, and the steps that led to it.
What they expected and what they saw: the exact message, or a screenshot.
Whether it happens every time or happened once.
Phone model and iOS or Android version, and whether they were on Wi-Fi, cellular data or in airplane mode.
2 · Read these steps to the member
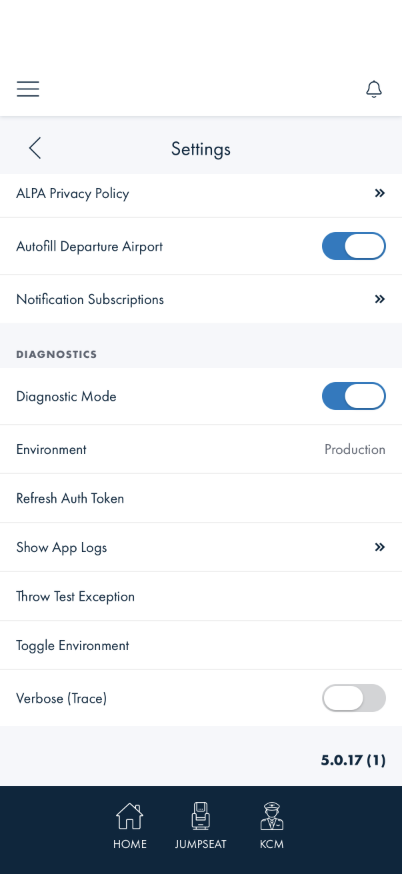
Tap the profile icon at the top right, then Settings.
Scroll to the bottom and tap the version number five times, quickly (within 3 seconds). No message
appears: a DIAGNOSTICS section shows up just above the version, and a dark strip appears across the top
of the screen. Both are expected.
If the problem can be repeated, repeat it now, then come back to Settings. For the next 24 hours the app
records extra detail.
In the DIAGNOSTICS section, tap Show App Logs, then Export (top right).
In the share sheet, tap Save to Files on iPhone, or a Files or Drive option on Android. The file is
named alpa-logs-<date>-<time>.zip.
Reply to the help desk ticket email and attach that file.
Tell the member not to tap anything else in DIAGNOSTICS. Toggle Environment signs
them out and points the app at a test server. Throw Test Exception sends a fake crash report. Refresh Auth
Token and Verbose (Trace) are for the development team.
Afterwards. Diagnostic Mode switches itself off after 24 hours and the DIAGNOSTICS section disappears. To
hide it sooner, tap the version number five times again.
For testers
The checks below confirm the App Logs screen works end to end on a build.
Before you start
Diagnostic Mode must already be on — see the Diagnostic
Mode walkthrough for how to reveal it (5 taps on the version number in Settings).
Sign in first: Settings is reached from the profile icon, which shows only when signed in.
No specific data setup needed: the list always has something in it, since just opening the
app and navigating generates log entries.
Checks
1 · Open App Logs
Steps: With Diagnostic Mode on, open Settings, scroll to the DIAGNOSTICS
group, and tap Show App Logs.
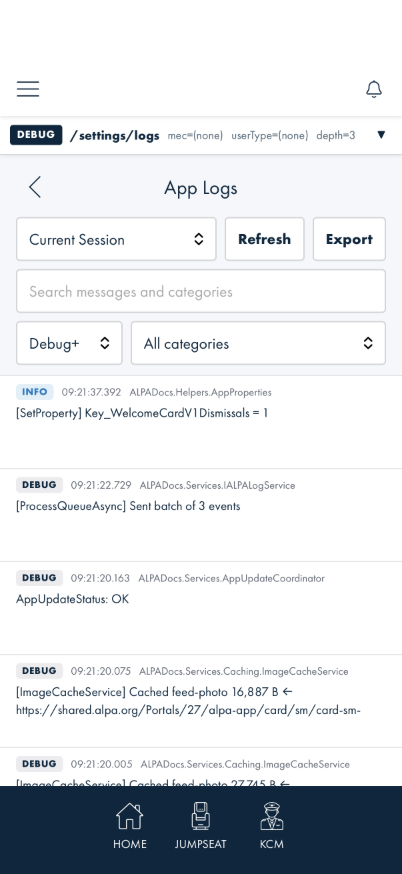
What you should see: An App Logs screen opens with a three-row toolbar: a date dropdown
(defaulted to Current Session) with Refresh and Export beside it; a full-width
Search messages and categories field; and a minimum-severity dropdown (Debug+ in a Debug build)
next to an All categories dropdown. The entries are listed below the toolbar. While Diagnostic Mode is
on, a dark debug strip naming the route (/settings/logs) sits above the page.
Something's wrong if: Tapping the row does nothing, or it bounces you to
the login screen instead of the App Logs screen.
2 · Read the current session's log
Steps: On the App Logs screen, just look at the list — no extra taps needed.
What you should see: Entries newest-first, every row the same height, each with a severity badge
(e.g. INFO, DEBUG), a timestamp to the millisecond, the source category (e.g.
ALPADocs.Services.Caching.ImageCacheService), and the message clamped to two lines. This is real
activity from this session (network calls, app events), not placeholder text. Typing in the search field or
picking a category narrows the rows in place.
Something's wrong if: The screen says "No log entries." despite the app
clearly having done something since launch, or the list never finishes loading.
3 · Filter by severity and confirm a real error appears
Steps: Go back to Settings → DIAGNOSTICS → tap Throw Test Exception. Then
open Show App Logs again and change the severity dropdown from Info+ to
Error+.
What you should see: The list narrows to one row: a red ERROR badge, category
System.Exception, message [ThrowTestException] Test Exception, and one
red line under it with the exception type and message (⚠ Exception: Test Exception).
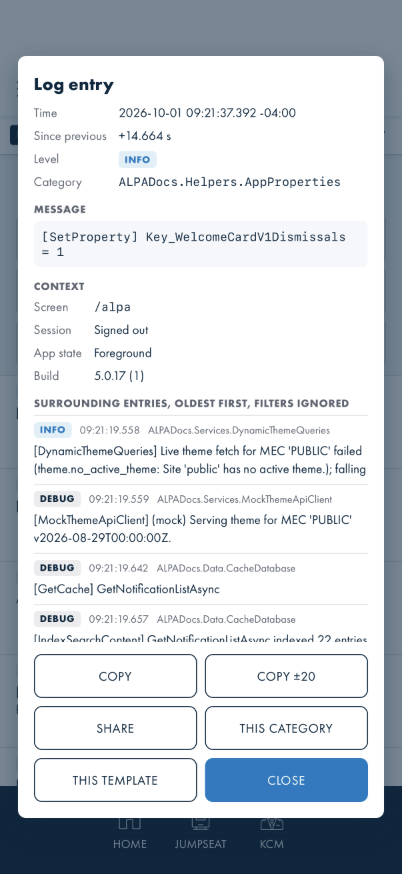
Every row is the same height; the list no longer shows stack traces. Tap the row once: the entry
opens with the full stack trace, the time to the millisecond, and Copy, Copy ±20, Share,
This category and This template buttons. Below the exception it shows a Context block:
the screen it was logged on, Signed in or Signed out, Foreground, and the app build. A log call
written with placeholders also shows its Template and Values; this error line has
none, because its template is the message itself, so This template keeps only identical
messages. Entries from a past day's file show a note instead of those blocks. The screenshot shows an INFO entry opened the same way: under the message come the Context block and the surrounding entries, then the buttons.
Something's wrong if: The error entry never appears, lower-severity
(e.g. INFO) rows still show up alongside it under the Error+ filter, the row is taller than the
others, tapping it does not open the entry with the full stack trace, or the Context block names
a member (it says only whether one was signed in).
4 · Export the logs
Steps: On the App Logs screen, tap Export.
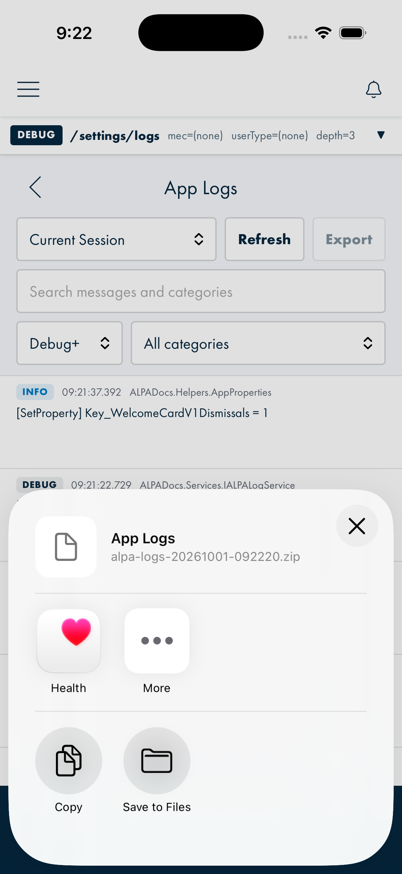
What you should see:Export dims (disabled) while the zip is built, then the device's native
share sheet opens, offering App Logs / alpa-logs-<date>-<time>.zip. The zip holds
every log file on the device (up to 7 days), whichever date is picked. The app keeps only its newest zip and deletes
older ones the next time it starts.
Something's wrong if: Nothing happens after tapping Export, or the button
stays dimmed with the share sheet never appearing.
What this checks, overall
The whole Show App Logs pipeline end to end: it's reachable only through Diagnostics, it shows
real captured entries rather than a mock, the severity filter narrows correctly, and a tester can
get the logs off the device (via the share sheet) to attach to a bug report — all without the old
native MetroLog screen.
What's not covered yet
Picking an earlier date, and the zip's contents. A Debug build never writes a log file, so only
Current Session has entries and its exported zip is empty. A Release/TestFlight build writes one file a
day (up to 20 MB) and keeps 7 days; a tester on one of those should confirm the date dropdown loads an earlier
day's entries and the zip holds those files.
Android. Also confirmed working on an Android Emulator during development (same
screens, same behavior, including the native share sheet) — screenshots above are iOS Simulator
only.
7-day retention. The auto-delete-after-7-days behavior isn't practical to walk in a
single sitting and isn't covered here.